|
Interpreting
and explaining the
1H (proton) NMR spectrum of 1-iodobutane
(butyl iodide)
CH3CH2CH2CH2I
[Author
©
Dr Phil Brown GRIC, PhD:
Doc Brown's advanced level organic chemistry exam revision notes
suitable for students of UK A level chemistry courses & US K12 grade
11, grade 12 and AP honors chemistry courses:
Molecular
spectroscopy analysis of
1-iodobutane (1H NMR
spectra)
[spectra page updated
RE-EDIT]
email doc
brown Re-edit
1H NMR
spectrum of
CH3CH2CH2CH2I
This is a BIG
website, PLEASE take time to explore it
Links associated with 1-iodobutane
* [privacy policy, cookies
and disclaimer]
H-1 proton NMR spectroscopy -
spectra index
See also
comparison of the infrared, mass, 1H NMR and 13C NMR
spectra of the four isomers of C4H9I
and
Isomers of molecular formula
C4H9X (where
X =
F, Cl, Br or I and basic data on NMR chemical shifts)
Practise exam questions based on the 1H NMR
spectrum of 1-iodobutane
Introductory note on the 1H NMR spectra of 1-iodobutane
Students and teachers please note my explanation of the
proton NMR spectrum of 1-iodobutane is designed for advanced, but
pre-university, chemistry courses.
The chemical shift
δ splitting pattern effects for
1-iodobutane are
confined to a proton spin-spin
coupling effects analysed using the n+1 rule for adjacent
non-equivalent proton fields (n is the number of neighbouring
protons in a non-equivalent different chemical environment for
the 1-iodobutane molecule).
It is assumed that the integrated intensities of the
δ chemical
shifts give the ratio of the protons in the different non-equivalent chemical
environments in the 1-iodobutane molecule.
The most common solvent used for investigating the 1H NMR
spectrum of compounds like 1-iodobutane, is CDCl3 and
other deuterated solvents to avoid confusion with a 1H
NMR signal, 2D (2H) has a different chemical
shift.
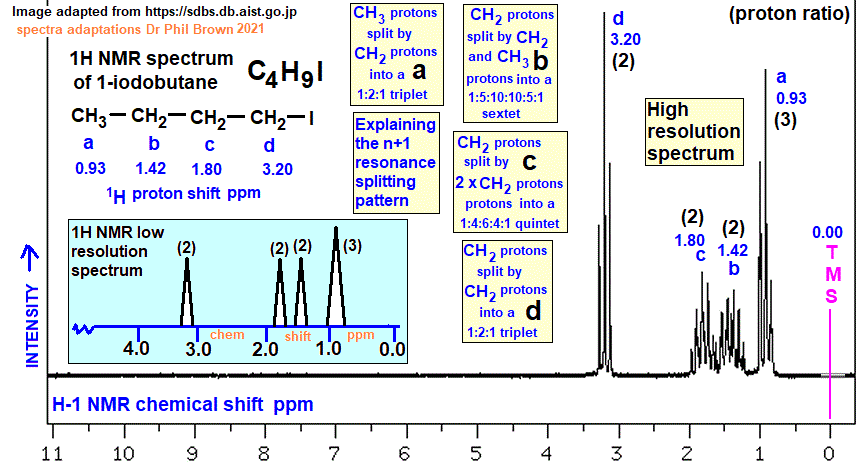
TMS is the acronym for tetramethylsilane, formula Si(CH3)4,
whose protons are arbitrarily given a chemical shift of 0.0 ppm.
This is the 'standard' in 1H NMR spectroscopy and all
other proton resonances, called chemical shifts, are measured
with respect to the TMS, and depend on the
individual (electronic) chemical environment of the hydrogen atoms
in an organic molecule - 1-iodobutane here.
The chemical shifts quoted in ppm on the diagram of
the H-1 NMR spectrum of 1-iodobutane represent the peaks of the intensity of
the chemical shifts of (which are often groups of split lines at
high resolution) AND the relative integrated areas under the peaks
gives you the ratio of protons in the different chemical
environments of the 1-iodobutane molecule.
1-iodobutane, (n-butyl
iodide), C4H9I,
CH3CH2CH2CH2I,
CH3-CH2-CH2-CH2-I
The molecular structure and naming of haloalkanes
Interpreting the
H-1 NMR spectrum of
1-iodobutane
In terms of spin-spin coupling from the possible proton magnetic orientations,
for 1-iodobutane I
have only considered the interactions of
non-equivalent protons on adjacent carbon atoms
e.g. -CH2-CH3,
R-CH2-CH- protons
etc.
For relatively simple molecules, the low
resolution H-1 NMR spectrum of 1-iodobutane is a good starting point
(low resolution diagram above).
The 9 hydrogen atoms (protons) of 1-iodobutane occupy
4
different chemical environments so that the low resolution NMR
spectra should show
4 principal
1H resonance peaks of different H-1 NMR chemical shifts (diagram above for
1-iodobutane).
CH3CH2CH2CH2I
Note the
proton ratio 3:2:2:2 of the 4 colours of the
9 protons of 1-iodobutane
in the 4 chemically different proton environments
Chemical shifts (a) to (d) on the H-1 NMR
spectrum diagram for 1-iodobutane.
Although there are 9 hydrogen atoms in the molecule, the
proton NMR spectrum shows there are only
4 possible different chemical
environments for the hydrogen atoms in 1-iodobutane molecule.
The integrated proton signal ratio
3:2:2:2 observed
in the high resolution H-1 NMR spectrum, corresponds with
the structural formula of 1-iodobutane.
The high resolution 1H NMR
spectrum of 1-iodobutane
The high resolution spectra of 1-iodobutane
shows 4 groups of proton resonances and in the
3:2:2:2
ratio expected from the
structural
formula of 1-iodobutane, but we can now consider the splitting of
resonance lines from the spin-spin coupling in the molecule of
1-iodobutane.
The ppm quoted on the diagram represent the peak
of resonance intensity for a particular proton group in the
molecule of 1-iodobutane - since the peak' is at the apex of a band of
H-1 NMR resonances due to spin - spin coupling field splitting effects - see high resolution
notes on 1-iodobutane below.
So, using the chemical shifts and applying the
n+1 rule to
1-iodobutane
and make some predictions using some colour coding! (In problem
solving you work the other way round!)
1H NMR resonance
(a) 1H Chemical shift 0.93 ppm: CH3CH2CH2CH2I
This resonance is split into a 1:2:1
triplet by the adjacent CH2 protons (n+1 =
3).
Evidence for the presence of a CH2 group
in the molecule of 1-iodobutane
1H NMR resonance
(b) 1H
Chemical shift 1.42 ppm: CH3CH2CH2CH2I
This resonance is split into a
1:5:10:10:5:1 sextet by the adjacent CH3 and CH2 protons
(on either side, so n+1 = 6).
Evidence for the presence of a
propyl group
in the molecule of 1-iodobutane
1H NMR resonance
(c) 1H
Chemical shift 1.80 ppm: CH3CH2CH2CH2I
This resonance is split into a 1:4:6:4:1
quintet by the adjacent CH2 protons on either
side, so n+1 = 5.
Evidence for the presence of a CH2-CHx-CH2 grouping
in the molecule of 1-iodobutane (x = 1, or 2, as in this
case).
1H NMR resonance
(d) 1H
Chemical shift 3.20 ppm: CH3CH2CH2CH2I
This resonance is split into a 1:2:1
triplet by the adjacent CH2 protons (n+1 =
3).
Evidence for the presence of a at least
one other CH2 group
in the molecule of 1-iodobutane (see resonance (a)
above).
The more
electronegative iodine moves the -CH2-I
protons downfield i.e. increased chemical shift.
Note the decreasing effect on the 1H chemical
shift as the proton is further from the more electronegative iodine atom
in 1-iodobutane.
|
QUESTIONS
Advanced A-level chemistry - practise exam questions on
the 1H NMR
spectrum of 1-iodobutane
This is a joint AI-doc b experiment!
Jot
down your responses and check out the answers:
ANSWERS
If you think there are
any errors, please email me asap at
chem55555@hotmail.com
I don't mind if students/teachers do a selected printout
of these questions and answers.
Q1
How many distinct ¹H NMR signals
appear in the spectrum of 1‑iodobutane?
A. 5 B. 3 C.
4 D. 2
Q2
Which integration
ratio matches the ¹H NMR spectrum of
1‑iodobutane?
A. 3 : 2 : 2 : 2
B. 2 : 2 : 2 : 2
C. 3 : 3 : 2 : 2
D. 1 : 2 : 3 : 2
Q3
Which proton
environment appears furthest downfield
(highest ppm)?
A. CH 3–
B. CH3–CH2–
C. –CH2–CH2–
D. –CH2–I
Q4
What splitting
pattern is expected for the CH3–
group?
A. Singlet B.
Doublet C. Triplet
D. Quartet
Q5
What splitting pattern is expected for –CH2–I?
A. Triplet B. Quartet
C. Doublet D. Multiplet
Q6
What splitting pattern is expected for the CH3
in CH3–CH2–?
A. Triplet B. Quartet
C. Multiplet D. Singlet
Q7
What is the most
realistic description of the splitting of the
middle –CH2–
group?
A. Singlet B. Triplet
C. Multiplet D. Doublet
of doublets
Q8
Which feature
identifies
1‑iodobutane?
A. A single signal integrating to 10H
B. A downfield triplet (2H) at ~2.8–3.2 ppm
C. A singlet (1H) at ~2 ppm
D. No signals above 1 ppm
Jot
down your responses and check out the answers:
ANSWERS
If you think there are
any errors, please email me asap at
chem55555@hotmail.com
|
|
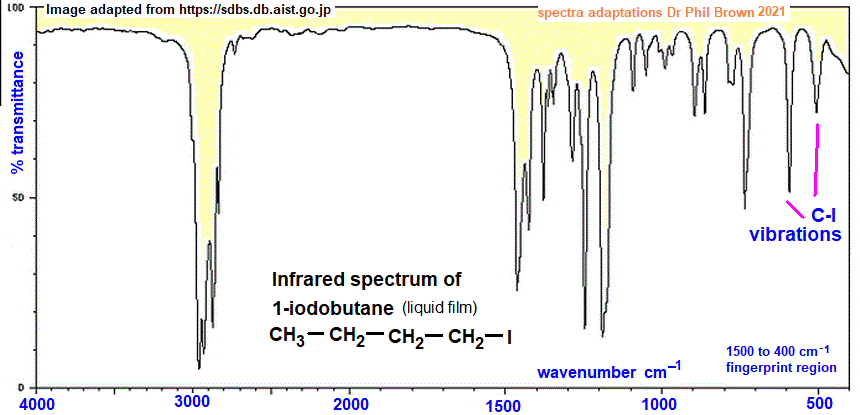
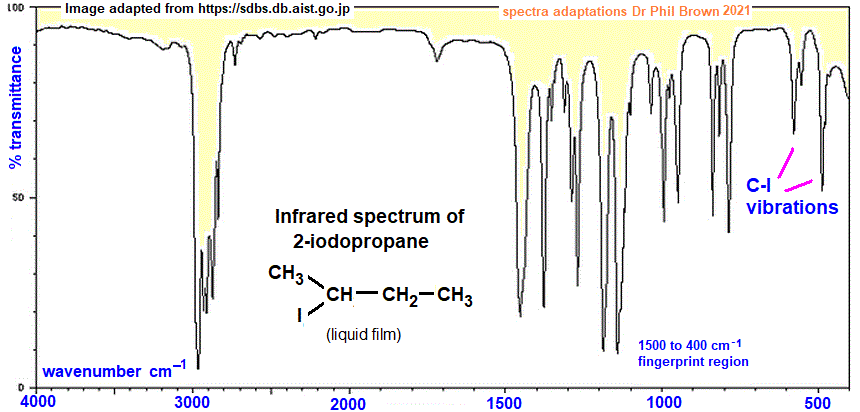
Comparing the infrared, mass, 1H NMR and 13C NMR
spectra of the 4 halogenoalkane isomers of C4H9I
NOTE: The images are linked to their
original detailed spectral analysis pages AND can be doubled in
size with touch screens to
increase the definition to the original 1-iodobutane,
2-iodobutane, 1-iodo-2-methylpropane and 2-iodo-2-methylpropane
image sizes. These four molecules
are structural isomers of molecular formula C4H9I
and
exemplify the infrared, mass, 1H NMR and 13C NMR spectra of lower
aliphatic halogenoalkanes (haloalkanes, alkyl halides,
iodoalkanes, alkyl iodides). |
 |
 |
 |
 |
|
INFRARED SPECTRA
(above):
Apart from the significant differences in the fingerprint region at
wavenumbers 1500 to 400 cm-1, there are no other
great striking differences, but each could be identified from
its infrared spectrum. |
 |
 |
 |
 |
|
MASS SPECTRA (above):
All four give the parent molecular ion of m/z 184, but it is
only a relatively tiny peak for 2-iodo-2-methylpropane. All four
give the base ion peak of m/z 57. All four give prominent peaks
for m/z ions 29 and 41 and all give a tiny peak from an ionised
iodine atom at m/z 127. They look quite similar to me and lack a
clear fingerprint fragmentation pattern. |
|
|
 |
 |
 |
|
1H NMR SPECTRA (above): The 1H NMR spectra of
all three molecules give different proton ratios i.e.1-iodobutane
four peaks 3:2:2:2, 2-iodobutane four peaks 3:3:2:1,
1-iodo-2-methylpropane three peaks 6:2:1 and
2-iodo-2-methylpropane one peak '1' (effectively no ratio
involved), so all four molecular structures can be distinguished from each other by their
1H NMR spectra proton ratios, numbers of peaks and (n+1)
rule splitting patterns. |
 |
 |
 |
 |
|
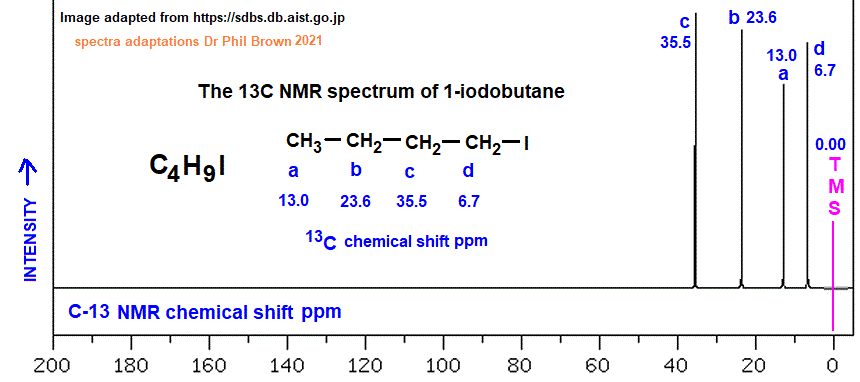
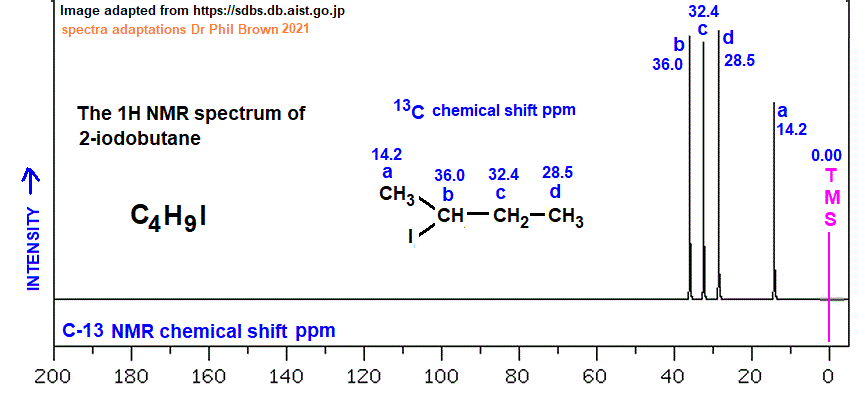
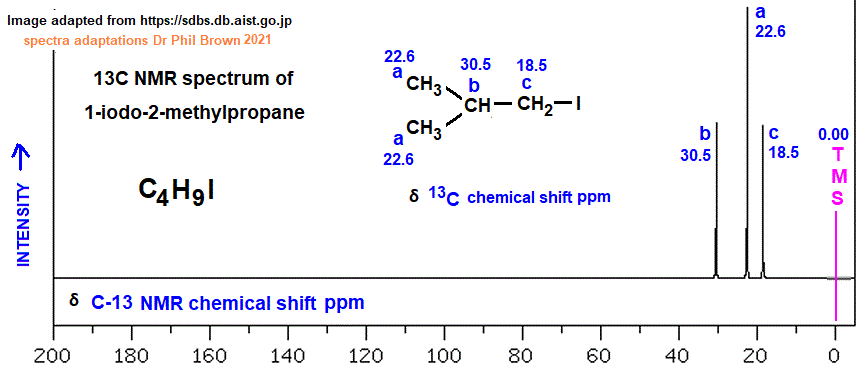
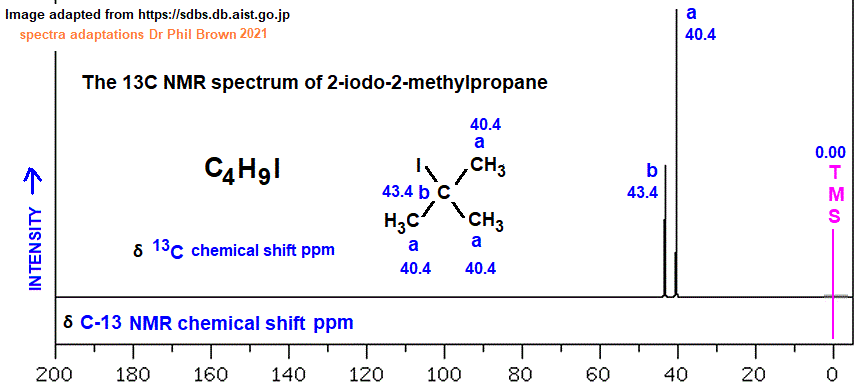
13C NMR SPECTRA
(above): The
13C NMR spectra of the four molecules show various numbers of
carbon-13 chemical environments i.e 1-iodobutane and
2-iodobutane show four 13C NMR resonances,
1-iodo-2-methylpropane three 13C NMR resonances and
2-iodo-2-methylpropane only two 13C resonances. Therefore
1-iodo-2-methylpropane and 2-iodo-2-methylpropane can be
distinguished from the other three by their number of resonances
in their 13C NMR spectra, but 1-iodobutane and 2-iodobutane
cannot be distinguished from each other from their number of 13C
NMR resonance lines - other data would be required. |
The splitting pattern from proton
spin-spin coupling effects is analysed using the n+1 rule for
adjacent non-equivalent proton fields (n is the number of
neighbouring protons in a non-equivalent different chemical
environment) and applied to the 1H NMR spectrum of
1-iodobutane.
|
Number of directly adjacent protons 1H
causing splitting |
Splitting pattern produced from the
n+1 rule on spin-spin coupling and the theoretical ratio of line intensities |
|
0
means no splitting |
|
|
|
|
|
|
1 |
|
|
|
|
|
|
|
1
creates a doublet |
|
|
|
|
|
1 |
|
1 |
|
|
|
|
|
|
2
creates a triplet |
|
|
|
|
1 |
|
2 |
|
1 |
|
|
|
|
|
3
creates a quartet |
|
|
|
1 |
|
3 |
|
3 |
|
1 |
|
|
|
|
4
creates a quintet |
|
|
1 |
|
4 |
|
6 |
|
4 |
|
1 |
|
|
|
5
creates a sextet |
|
1 |
|
5 |
|
10 |
|
10 |
|
5 |
|
1 |
|
|
6
creates a septet |
1 |
|
6 |
|
15 |
|
20 |
|
15 |
|
6 |
|
1 |
Key words & phrases:
isomer
of molecular formula C4H9I CH3CH2CH2CH2I
Interpreting the proton H-1 NMR spectra of 1-iodobutane, low resolution & high
resolution proton nmr spectra of 1-iodobutane, H-1 nmr spectrum of 1-iodobutane, understanding the
hydrogen-1 nmr spectrum of 1-iodobutane, explaining the line splitting patterns from
spin-spin coupling in the high resolution H-1 nmr spectra of 1-iodobutane, revising
the H-1 nmr spectrum of 1-iodobutane, proton nmr of 1-iodobutane, ppm chemical shifts of the H-1
nmr spectrum of 1-iodobutane, explaining and analyzing spin line splitting in the
H-1 nmr spectrum, how to construct the diagram of the 1H nmr spectrum of
1-iodobutane, how to work out the
number of chemically different protons in the structure of the 1-iodobutane organic
molecule, how to analyse the chemical shifts in the hydrogen-1 H-1 proton NMR
spectrum of 1-iodobutane using the n+1 rule to explain the spin - spin coupling ine
splitting in the proton nmr spectrum of 1-iodobutane deducing the nature of the protons
from the chemical shifts ppm in the H-1 nmr spectrum of 1-iodobutane
examining the 1H nmr spectrum of 1-iodobutane analysing the 1H nmr spectrum of
1-iodobutane
how do you sketch and interpret the H-1 NMR spectrum of 1-iodobutane
interpreting interpretation of the 1H proton spin-spin coupling causing line
splitting in the NMR spectrum of 1-iodobutane
assignment of chemical shifts in the
proton 1H NMR spectrum of 1-iodobutane formula explaining spin-spin coupling for
line splitting for 1-iodobutane
functional group
haloalkane halogenoalkane alkyl bromide n-butyl
iodide Molecular structure diagram of the
proton NMR diagram for the 1H NMR spectrum of 1-iodobutane. The proton ratio in the
1H NMR spectrum of 1-iodobutane. Deducing the number of different chemical
environments of the protons in the 1-iodobutane molecule from the 1H chemical shifts
in the hydrogen-1 NMR spectrum of 1-iodobutane. Analysing the high resolution 1H NMR
spectrum of 1-iodobutane. Analysing the low resolution 1H NMR spectrum of
1-iodobutane. You
may need to know the relative molecular mass of 1-iodobutane to deduce the molecular
formula from the proton ratio of the 1H NMR spectrum of 1-iodobutane. Revision notes
on the proton NMR spectrum of 1-iodobutane. Matching and deducing the structure of
the 1-iodobutane molecule from its hydrogen-1 NMR spectrum.
Proton NMR spectroscopy of halogenoalkanes iodoalkanes,
1H NMR spectra of 1-iodobutane, an isomer of molecular formula
C4H9I
How do you interpret the H-1 NMR spectrum of
1-iodobutane How to interpret
the H-1 NMR spectrum of 1-iodobutane Explanatory diagram of the chemical
shifts of the 1H H-1 proton NMR spectrum of the 1-iodobutane
molecule in terms of its molecular structure. Listing data of all the chemical shift peaks in ppm in the
proton NMR spectrum of 1-iodobutane. How to explain the H-1 NMR spectrum of
1-iodobutane. The chemical shifts and integrated values of the proton ratios in the 1-H NMR
spectrum of the 1-iodobutane molecule. How to work out the molecular
structure of the 1-iodobutane molecule from its proton NMR spectrum. The uses
and distinctive features of the proton NMR spectrum of the
1-iodobutane
molecule explained. What does the H-1 proton NMR spectrum chemical
shifts tell us about the
structure and properties of the 1-iodobutane
molecule? explaining the spin-spin proton coupling effects in the 1H
NMR spectrum of 1-iodobutane. interpretation
diagram explaining the proton splitting pattern produced from the
n+1 rule and the theoretical ratio of chemical shift
δ and values of
intensities for the proton NMR spectrum lines of 1-iodobutane
Links associated
with
1-iodobutane
The chemistry of HALOGENOALKANES (haloalkanes)
revision notes INDEX
The infrared spectrum of 1-iodobutane
(n-butyl iodide)
The mass
spectrum of 1-iodobutane (n-butyl iodide)
The
C-13 NMR spectrum of 1-iodobutane (n-butyl iodide)
H-1 proton NMR spectroscopy index
(Please
read 8 points at the top of the 1H NMR index page)
ALL SPECTROSCOPY INDEXES
All Advanced Organic
Chemistry Notes
Use My Google search site box
Email doc b:
chem55555@hotmail.com
Index of my advanced
(pre-college/university) organic
chemistry revision notes
Index
of all my spectroscopy pages
Index
of all my isomerism pages
The chemistry of
alkanes and the petrochemical
industry
The
chemistry of alkenes
The
chemistry of haloalkanes
The
chemistry of
alcohols
The chemistry of
aldehydes
and ketones The
chemistry of carboxylic acids and derivatives The chemistry of
organo-nitrogen compounds
The chemistry of
aromatic compounds
Website content © Dr
Phil Brown 2000+. All copyrights reserved on revision notes, images,
quizzes, worksheets etc. Copying of Doc Brown's pre-university
advanced level chemistry website material is NOT
permitted. Exam revision summaries & references to science course specifications
are unofficial. These organic chemistry revision notes on
spectroscopy (on the 1H NMR spectrum of 1-iodobutane, detailed
diagram of spectra and analysis explained) suitable for use of pre-university students studying AQA advanced level
chemistry, Edexcel advanced level chemistry, OCR advanced level
chemistry, IB advanced level chemistry, WJEC (Eduqas) advanced level
chemistry, CIE advanced level chemistry, CCEA advanced level chemistry, US grade 11-12 AP honors
chemistry courses and they will also prove useful to
1st year undergraduate students of chemistry.
|
ANSWERS
Advanced A-level chemistry - practise exam questions on
the 1H NMR
spectrum of 1-iodobutane
If you think there are
any errors, please email me asap at
chem55555@hotmail.com
I don't mind if students/teachers do a selected printout
of these questions and answers.
Q1
How many distinct ¹H NMR signals
appear in the spectrum of 1‑iodobutane?
A. 5 B. 3 C.
4 D. 2
Correct answer: C
Explanation: Four different
proton environments:
3–CH2–
–CH2–CH2–
–CH2–I
Misconception: Students often
assume the two internal CH2 groups
are equivalent. They are not: one is closer to
iodine, chemical shift more downfield (increases
ppm).
Q2
Which integration
ratio matches the ¹H NMR spectrum of
1‑iodobutane?
A. 3 : 2 : 2 : 2
B. 2 : 2 : 2 : 2
C. 3 : 3 : 2 : 2
D. 1 : 2 : 3 : 2
Correct answer:
A
Explanation:
Total protons = 3H (CH3)
+ 2H + 2H + 2H.
Misconception:
Thinking integration must add to a “round
number”. Only
ratios matter.
Q3
Which proton
environment appears furthest downfield
(highest ppm)?
A. CH 3–
B. CH3–CH2–
C. –CH2–CH2–
D. –CH2–I
Correct answer: D
Explanation: Iodine is less
electronegative than Br or Cl, but still
deshields the adjacent CH 2
→ ~2.8–3.2 ppm.
Misconception: Assuming iodine
is “too big to affect NMR”. Electronegative
atoms still shift signals downfield.
Q4
What splitting
pattern is expected for the CH3–
group?
A. Singlet B.
Doublet C. Triplet
D. Quartet
Correct answer: C
Explanation: Adjacent CH 2
→ n+1 = 2+1 = 3 → triplet.
Misconception: Counting all
protons in the chain. Only neighbouring
equivalent protons matter.
Q5
What splitting pattern is expected for –CH2–I?
A. Triplet B. Quartet
C. Doublet D. Multiplet
Correct answer: A
Explanation: Adjacent CH 2
(2H) → n+1 = 3 → triplet.
Misconception: Believing
halogens cause splitting. They do not
split ¹H signals.
Q6
What splitting pattern is expected for the CH3
in CH3–CH2–?
A. Triplet B. Quartet
C. Multiplet D. Singlet
Correct answer: C
Explanation: Adjacent to CH3
(3H) and another CH2
(2H). Two non‑equivalent neighbour sets →
complex splitting → multiplet.
Misconception: Applying n+1 to
the total neighbouring protons
(6 → sextet).
Q7
What is the most
realistic description of the splitting of the
middle –CH2–
group?
A. Singlet B. Triplet
C. Multiplet D. Doublet
of doublets
Correct answer: C
Explanation: Adjacent to two
different CH2
groups (2H + 2H). Coupling constants differ →
unresolved multiplet. Simple
application of the n+1 rule gives a quintet.
Misconception: Assuming it must
be a triplet because “it’s next to two protons”.
Those protons are not equivalent.
Q8
Which feature
identifies
1‑iodobutane?
A. A single signal integrating to 10H
B. A downfield triplet (2H) at ~2.8–3.2 ppm
C. A singlet (1H) at ~2 ppm
D. No signals above 1 ppm
Correct answer:
B
Explanation:
1‑Iodobutane has
CH2–I
→ 2H triplet at ~2.8–3.2 ppm. 2‑Iodobutane has
CH–I →
1H multiplet.
Misconception:
Assuming all iodinated alkanes show CH2–I.
Secondary iodides do not.
If you think there are
any errors, please email me asap at
chem55555@hotmail.com
|
|
