|
STATES OF MATTER Part 13.
The
behaviour and
properties of gases and liquids (fluids) and solids
13.
State changes, temperature changes, all
explained for
heating curve and a cooling curve using the ideas of latent heat
and
the kinetic particle model and kinetic energy of particles
The cooling curve of state changes,
latent heat and particle theory
The
heating curve of state changes, latent heat and particle theory
KEY POINTS: Latent heat
& particle models - describing & explaining heating/cooling curves
A
summary exam question for you with answers to simplify these complex processes
- not an easy topic
[Author
©
Dr Phil Brown PhD:
Doc Brown's chemistry exam revision notes on
states of matter - physical properties of gases, liquids and solids,
suitable for students of UK GCSE
level and international
IGCSE/O level chemistry courses, ~US grades 9-10 chemistry notes [page updated
RE-EDIT]
EMAIL query ? comment
*
[privacy, cookies policies and disclaimer]
The gas
<==> liquid <==> solid sequences are described in terms of temperature
versus time graphs on heating or cooling a substance and explained by
the kinetic particle model of the states of matter AND the concept
of latent heat.
INDEX of all my notes on the states of matter
GCSE (~US grades 8-10) level multiple choice QUIZ on
the states of matter: gases, liquids & solids
|
13a.
Cooling and Heating Curves and the energy changes for changes of state: gas <=>
liquid <=> solid

Below the melting/freezing point, the substance is a liquid.
Between the melting/freezing point and the boiling point, the substance is a
liquid. Above the boiling point, the substance is a gas/vapour.
|
|
The
cooling curve of state changes for a substance gas => liquid => solid
The processes of
condensing and freezing
and their latent heats
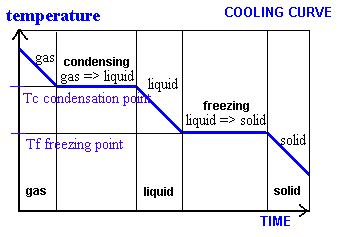
2f(i)
The theoretical
cooling curve
from gas ==> liquid ==> solid
What happens to the temperature of a substance if it is cooled from the
gaseous state to the solid state?
As thermal energy (heat
energy) is removed from the substance (the system) by lowering the
temperature, the gas will first condense to a liquid at temperature Tc and then
eventually solidifies (freezes) at temperature Tf.
As the temperature decreases the average kinetic energy (KE) of the particle
decreases.
Note the temperature stays constant during the state changes of condensing
at temperature Tc, and freezing/solidifying at temperature Tf,
at the horizontal sections of the graph.
These are the two points (temperatures) where the latent heat of
vaporisation (condensation) and the
latent heat of fusion (freezing) are removed/lost from the substance/system.
Remember, numerically (ignoring +/- signs), the latent heat of
condensation is just the same as the latent heat of
boiling/vaporisation and the latent heat of freezing is just the same
as the latent heat of melting/fusion.
In between the horizontal sections of the graph, the downward
curves of falling temperature, means the kinetic energy of the particles
is decreasing.
This is because all the heat energy removed on cooling at these temperatures
(the
latent heats or enthalpies of state change), the lower kinetic energy
of the particles allows
the strengthening of the inter–particle forces (intermolecular bonding) without temperature fall
and effect the condensation at Tc (gas to liquid) and freezing at Tf (liquid
to solid).
The
heat loss on cooling is compensated by the exothermic energy release (latent
heat)
from the intermolecular
force attraction between the particles on condensation or freezing,
so the temperature stays constant until all the substance has changed
state (condensation, then freezing).
In between the 'horizontal' state change sections of the graph, you can
see the energy 'removal' reduces the kinetic energy of the particles,
lowering the temperature of the substance without change of sates.
A cooling curve summarises the changes:
gas ==> liquid
==> solid
For each change of state, energy must be
removed,
known as the 'latent heat'
Actual energy values for these physical
changes of state for a range of substances are dealt with in more detail in the
Energetics Notes.
A simple
experiment to illustrate a 'cooling curve'
-
Its not so easy to do a cooling curve
by reversing the experiment described above for a 'heating curve'
because in the context of school experiments you can't start with hot
vapour!
-
However, you can do a 'partial'
cooling curve experiment using a low melting solid like stearic acid.
-
You start with boiling tube with a
few cm depth of stearic acid in it plus a 0 to 100oC
thermometer.
-
Place the boiling tube in hot water
until all the 'waxy' stearic acid melts.
-
Keep on heating it until the
temperature reads at least 80oC.
-
Remove the boiling tube and record
the temperature of the melted acid.
-
Allow the tube of melted acid to cool
on its own and record the temperature every minute until all of the acid
has gone solid AND keep on recording for at least another 5 minutes.
-
Plot a graph of temperature versus
time and it should look like the right-hand sections of the graph above.
-
In the middle of the graph should be
a horizontal section corresponding to the transfer of the latent heat of
fusion to the surroundings at the freezing point - to enable the kinetic
energy of the molecules to fall sufficiently for the intermolecular
forces to increase and cause solidification (crystallisation of the
stearic acid molecules).
-
Your graph should look something like
the right-hand section of the graph above and the graph below.
-
The temperature of the horizontal
section is the freezing/melting point, and is 80oC for
stearic acid.
|
|
The
heating curve of state changes for a substance solid => liquid => gas
The processes of melting and
boiling and their latent heats.

2f(ii)
The theoretical heating curve
from solid ==> liquid ==> gas
What happens to the temperature of a
substance if it is heated from the solid state to the gaseous state?
As thermal energy
(heat energy) is added to the substance (the system) by increasing the
temperature, the solid first melts at temperature Tm and then eventually
the liquid boils at temperature Tb.
As the temperature increases the average kinetic energy of the
particle increases.
Note the temperature stays constant during the state changes of
melting
at temperature Tm and the boiling point temperature at Tb, at the horizontal
sections of the graph.
These are the two points (temperatures) where the latent heat of melting/fusion and
the latent heat of boiling/vaporisation are gained/added to the
substance/system.
This is because all the energy absorbed in
heating at these temperatures
(the latent heats or enthalpies of state change),
goes into weakening the inter–particle
forces (intermolecular bonding) without temperature rise.
The heat energy gain
by the material
equals the endothermic thermal energy (heat energy) absorbed that is required to
reduce the intermolecular forces to melt or boil the substance at a
constant temperature.
In these horizontal
sections of the graph, the temperature stays constant until all the
material has melted, or at the higher temperature, all the material has
boiled to a gas.
In between the horizontal sections of the graph, the upward curves of
rising temperature, means the kinetic energy of the particles is
increasing.
So, in between the 'horizontal' state change
sections of the graph, you can see the energy input increases the
kinetic energy of the particles and raising the temperature of the
substance.
A heating curve summarises the changes:
solid
==> liquid ==> gas
For each change of state, energy must be added,
known as the 'latent heat'
Actual energy values for these physical
changes of state for a range of substances are dealt with in more detail in the
Energetics Notes.
A simple
experiment to illustrate a 'heating curve'
-
You start with a beaker of crushed
ice into which you place a thermometer (-10 to 110oC
thermometer).
-
Place on a tripod and gauze and
record the temperature at the start.
-
To speed things up, heat the beaker
of ice steadily with a Bunsen flame.
-
Continue to record the temperature
every minute until all the ice has melted and eventually the water will
boil.
-
Finish taking temperature readings
after 5 minutes of boiling.
-
Plot a graph of temperature versus
time.
-
It should look like the graph above,
apart from the initial rise of temperature of solid ice.
-
You should get
two horizontal
sections on the graph where the latent heat of fusion (melting at 0oC)
or the latent heat of boiling (vaporising at 100oC) are
being absorbed to weaken the intermolecular forces between the water
molecules, without rise in temperature.
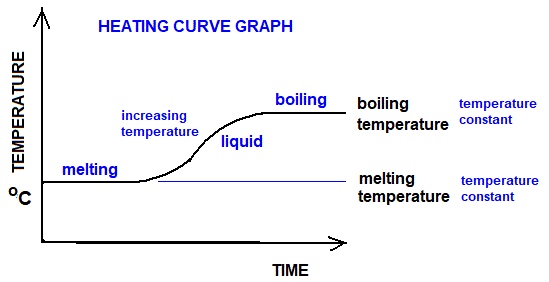
General heating curve for the melting and boiling of a substance

The heating curve for
melting ice and boiling water which you can determine in a simple
laboratory experiment.
For water the horizontal line
temperatures are melting point 0oC and boiling point 100oC
It is difficult to get temperature
readings of (e.g. -18oC) ice from the freezer, which is why
the graphs starts at the melting point of ice. and no preliminary curve
upwards is shown.
Similarly, in the context of school
experiments, it is difficult to get readings of steam above 100oC.
INDEX of notes on Particle model theory
state changes and latent heat
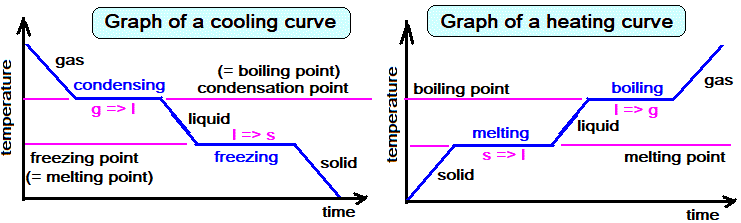
A
quick comparison of cooling and heating graph curves.
SPECIFIC LATENT HEATS
- refer to diagram below

The latent heat for the state changes solid <=> liquid
is called the specific latent heat of fusion (for melting or freezing).
The latent heat for the state changes liquid <=> gas is
called the specific latent heat of vaporisation (for condensing,
evaporation or boiling)
For more on latent heat see my physics notes on
specific latent heat
Note that not all the terms
used to describe latent heat energy changes fitted on the diagram, so note:
(i) The latent heat of
fusion/melting = latent heat of freezing/solidifying
(ii) The latent heat of
boiling/evaporation/vaporisation = latent heat of condensation
|
How a refrigerator works
In a refrigeration the refrigerant gas is compressed to a
liquid and the latent heat is released and transferred through heat
exchanger tubes/fins at the back of the fridge.
The compressed liquid is pumped around in copper tubing in
the inner panelling of the refrigerator where it evaporates, absorbing the
latent heat of evaporation.
This completes the cycle of removing thermal (heat) energy
from inside the refrigerator to the outside air - that's why you can feel
warm air at the back of a refrigerator.
KEY
POINTS about heating curves and cooling curves
These are syllabus-aligned revision
notes tailored for IGCSE/GCSE chemistry students across the major
UK boards (WJEC, CCEA, CIE, AQA, Edexcel, OCR Gateway, OCR 21st Century).
They are broken it down into
concepts, experiments, exam tips, and misconceptions so it’s clear
and comprehensive.
Core Concept:
Heating curves and Cooling Curves
1.
Kinetic Particle Model
- Solids:
Particles vibrate in fixed positions, strong forces of attraction.
- Liquids:
Particles slide past each other, weaker forces, more kinetic energy.
- Gases:
Particles move freely, negligible forces, high kinetic energy.
2.
Heating Curve (solid → liquid →
gas)
- Sloping regions:
Temperature rises → kinetic energy of particles increases.
- Flat regions (plateaus):
Temperature constant → energy used to overcome intermolecular forces (latent
heat).
- Latent heat of fusion:
Solid → liquid (melting).
- Latent heat of vaporisation:
Liquid → gas (boiling).
Example:
Heating ice at 0 °C → temperature stays constant until all ice melts, then rises
again.
3.
Cooling Curve (gas → liquid →
solid)
- Sloping regions:
Temperature falls → kinetic energy decreases.
- Flat regions:
Temperature constant → energy released as intermolecular forces reform.
Example:
Steam condensing at 100 °C → temperature stays constant until all steam becomes
liquid.
A general
question on
heating and cooling curves
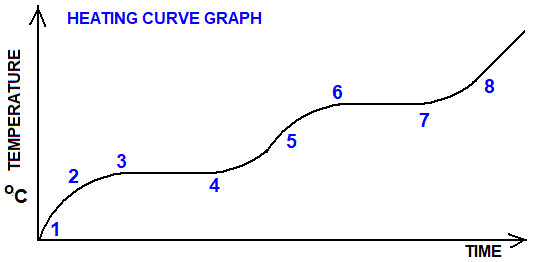
GCSE chemistry students need to be able to
describe what is going on at every stage and relate each one to the kinetic
particle theory of matter and latent heat of changes in state solid <=>
liquid <=> gas/vapour
In both cases can you jot down and describe
what is happening and why?
ANSWERS
Laboratory
Experiment for a heating curve
Investigating a heating curve of water
- Place crushed ice in a beaker with a
thermometer.
- Heat gently with a Bunsen burner.
- Record temperature every 30 seconds until
water boils.
- Plot graph: temperature versus time →
heating curve.
Safety:
Goggles, careful with hot water/steam, avoid burns.
Typical Exam Board
Requirements for heating and cooling curves
All boards (WJEC, CCEA, CIE, AQA, Edexcel, OCR
Gateway, OCR 21st Century) require:
- Understanding particle model
(solid/liquid/gas).
- Explaining heating/cooling curves
using kinetic theory.
- Latent heats
(fusion, vaporisation).
- Experimental design:
heating/cooling curve investigation.
- Graph interpretation:
identifying phase changes, energy transfers.
Exam Tips for
questions involving heating and cooling curves
- Label graphs clearly:
sloping versus flat regions.
- Use correct terminology:
“latent heat of fusion/vaporisation” not just “energy.”
- Explain why temperature is
constant: energy goes into
breaking/forming bonds, not raising kinetic energy.
- Always link to particle model:
movement, spacing, forces.
- Units:
°C for temperature, joules for energy.
- Compare heating versus cooling
curves: mirror images but same
principles.
Typical
Misconceptions about heating and cooling curves
Quick Overlay Table
for heating and cooling curves
| Curve Region |
Energy Change |
Particle Explanation |
Term |
| Sloping (solid/liquid/gas) |
Kinetic energy ↑ |
Faster vibrations/movement |
Sensible heat |
| Plateau (melting/boiling) |
Potential energy ↑ |
Bonds broken |
Latent heat (fusion/vaporisation) |
| Cooling sloping |
Kinetic energy ↓ |
Slower movement |
Sensible heat |
| Cooling plateau |
Potential energy ↓ |
Bonds formed |
Latent heat released |
The word bonds here means inter-particle bonding forces between
molecules, NOT covalent or ionic bonds between atoms.
Learning objectives for the state changes
graph when heating a solid or cooling a gas/vapour
Be able to interpret the graph for the
cooling curve of a substance from gas to liquid to solid.
Be able to interpret the graph for the
heating curve of a substance from solid to liquid to gas.
Be able to recognise on the heating curve
where the temperature stays constant at the melting point and boiling point.
Be able to recognise on the cooling curve
where the temperature stays constant at the condensation point and freezing
point.
Be able to describing the state changes in
terms of the latent heat thermal energy required to be added or removed to
effect the change of state and this causes the temperature to remain
constant as long as the state change is taking place.
Understand that increasing the temperature
increases the average kinetic energy of the molecules and this decreases the
attractive forces between the particles.
Understand that decreasing the temperature
decreases the average kinetic energy of the molecules and this increases the
attractive forces between the particles.
Be able to explain that at the melting
point the interparticle forces are sufficiently weakened to allow free
movement of the particles to form a liquid.
Be able to explain that at the boiling
point the interparticle forces are sufficiently weakened to allow sufficient
free movement of the particles to form a gas because the particles can
escape the attractive forces in the liquid.
All my
UK GCSE level (~US grade 8-10) school chemistry revision
notes
All my UK advanced level (~US grades 11-12)
pre-university chemistry revision notes
This is a BIG
website, you need to take time to explore it [ SEARCH
BOX]
Email doc
brown - comment? query?
Explaining importance of using latent heats
to explain heating & cooling curves
in GCSE level chemistry, What you need to know about using latent heats
to explain heating & cooling curves for
GCSE level
chemistry,
Explaining use of using latent heats to explain heating & cooling curves knowledge in GCSE level chemistry, Examples of
using latent heats to explain heating & cooling curves
explained when studying GCSE level chemistry, What is the significance
of using latent heats to explain heating & cooling curves in GCSE level chemistry, describing
explaining theory of using latent heats to explain heating & cooling
curves when studying GCSE level chemistry, exam revision
notes for using latent heats to explain heating & cooling curves, online help for understanding
using latent heats to explain heating & cooling curves in GCSE
chemistry, what do I need to learn about using latent heats to explain
heating & cooling curves? what do I need to know
about using latent heats to explain heating & cooling curves for GCSE chemistry exams, how to prepare for questions on
using latent heats to explain heating & cooling curves in GCSE
chemistry examination? using latent heats to explain heating & cooling
curves for
syllabus-specifications
for students taking the IGCSE/GCSE level chemistry examinations, summary
revision notes key points on using latent heats to explain heating &
cooling curves for students studying AQA
igcse/gcse chemistry notes on using latent heats to explain heating & cooling
curves, Edexcel gcse
chemistry notes on using latent heats to explain heating & cooling
curves, OCR 21st century GCSE
chemistry notes on using latent heats to explain heating & cooling
curves, OCR gateway
GCSE chemistry notes on using latent heats to explain heating &
cooling curves, WJEC gcse chemistry notes on using latent heats to
explain heating & cooling curves, CCEA
gcse chemistry notes on using latent heats to explain heating & cooling
curves, CIE Cambridge igcse
chemistry, notes on
using latent heats to explain heating & cooling curves useful for US grade 9-10
|
ANSWERS to practise questions
Heating curve
explanation simplified
Heating curve explanation simplified
1. to 3. solid at low temperature,
minimum KE of vibration, solid increasing in temperature, no latent heat
involved, but particles increase in KE, which weakens the interparticle
forces.
3. to 4. latent heat of melting/fusion
is
absorbed when particles have already gained enough KE to reduce inter-particle forces
and melt. There is no further increase in KE, the energy absorbed is used to melt
the substance at a constant temperature. Here the potential energy is
increasing, but not the KE.
4. to 6. all the solid is now melted
(at 4.), KE increases
with rise in temperature of the liquid.
6. to 7. KE of particles now have
sufficient to further overcome the inter-particle forces and boiling
occurs starting at 6. The latent heat of evaporation/boiling is now used to boil the
substance with no increase in temperature as the gas forms. Here
the potential energy is increasing, but not the KE.
7. to 8. At 7. all the substance is now in a
gaseous state and the particles have increasingly greater KE as the temperature
rises.
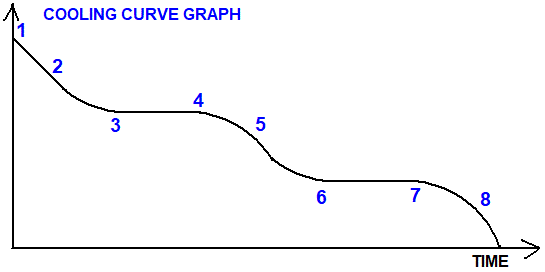
Cooling curve
explanation simplified
Cooling curve
explanation simplified
1. to 3. The substance is a gas/vapour at higher
temperature, cooling down as the KE decreases.
3. to 4. At 3. the temperature and particle KE
are low enough for the inter-particle forces to be strong enough to cause
condensation to a liquid, starting at 3. The temperature stays constant from 3. to 4. as
the latent heat of vaporisation (condensation) is lost. At 4. all the substance is
now condensed to a liquid.
Here the potential energy is decreasing, but not the KE.
4. to 6. KE of particles fall as heat energy
lost and temperature falls.
6. The particle KE is low enough for
inter-particle forces to be strong enough for the solid to start to form
6. to 7. the temperature stays constant as the
latent heat of fusion/freezing is lost. Here the potential energy is
decreasing, but not the KE.
7. to 8. At 7. all the liquid has solidified
and the temperature and KE of the particles now fall past 8 as more
thermal energy is lost on cooling.
|
chemistry student courses
|
  Website
content © Dr Phil Brown 2000+. All copyrights reserved on Doc
Brown's Chemistry revision notes, images, quizzes, worksheets etc.
Copying of website material is NOT permitted.
GCSE level and advanced pre-university level
revision notes. Detailed
notes on the states of matter and their properties.
Based on the syllabus-specifications for students taking the IGCSE/GCSE
level physics examinations summary revision notes and key points about
describing, with temperature graphs and explanations of the results of observing
the changes in heating curve and a cooling curve,
for students taking the WJEC gcse
chemistry/physics, CCEA gcse chemistry/physics, CIE igcse chemistry/physics, AQA
igcse/gcse physics, Edexcel gcse chemistry/physics, OCR 21st century chemistry/physics, OCR gateway
chemistry/physics or any other GCSE or IGCSE level chemistry/physics
exams e.g. US grade 9-10 physics courses Website
content © Dr Phil Brown 2000+. All copyrights reserved on Doc
Brown's Chemistry revision notes, images, quizzes, worksheets etc.
Copying of website material is NOT permitted.
GCSE level and advanced pre-university level
revision notes. Detailed
notes on the states of matter and their properties.
Based on the syllabus-specifications for students taking the IGCSE/GCSE
level physics examinations summary revision notes and key points about
describing, with temperature graphs and explanations of the results of observing
the changes in heating curve and a cooling curve,
for students taking the WJEC gcse
chemistry/physics, CCEA gcse chemistry/physics, CIE igcse chemistry/physics, AQA
igcse/gcse physics, Edexcel gcse chemistry/physics, OCR 21st century chemistry/physics, OCR gateway
chemistry/physics or any other GCSE or IGCSE level chemistry/physics
exams e.g. US grade 9-10 physics courses
INDEX of all my notes on the states of matter
GCSE (~US grades 8-10) level multiple choice QUIZ on
the states of matter: gases, liquids & solids |
|

 ENTER
chemistry words e.g. topic, module, exam board,
formula, compound, reaction, structure, concept, equation, any 'phrase',
homework question! anything of chemical interest, like your latest homework question!
or anything
of scientific interest! This is a very comprehensive Google
generated search of my website.
ENTER
chemistry words e.g. topic, module, exam board,
formula, compound, reaction, structure, concept, equation, any 'phrase',
homework question! anything of chemical interest, like your latest homework question!
or anything
of scientific interest! This is a very comprehensive Google
generated search of my website.