HOME PAGE * SEARCH * UK KS3 level Science Quizzes for students aged ~13-14

UK GCSE level BiologyChemistryPhysics ~14-16 * Advanced Level Chemistry ~16-18

School Physics Notes: Forces & motion 2.3 Acceleration, velocity-time graph Qs

GCSE level physics exam revision notes: velocity & acceleration

Forces and Motion 2.3 Acceleration formula, problem solving calculations and interpreting velocity-time graphs

[Author © Dr Phil Brown PhD: Doc Brown's physics exam revision notes suitable for students of UK IGCSE & GCSE level physics courses, ~ US grades 9-10 physics [updated Mar 20th 2026 *]

[KEY POINTS and learning objectives for this page, after initial notes]

 email doc brown: problems?, comments? query? * [privacy & cookies policies & disclaimer]

INDEX for notes on acceleration, deceleration, constructing and interpreting velocity/speed-time graphs

This page contains online questions only.

Jot down your answers. check them against the worked out answers at the end of the page


2.3 Acceleration formula, problem solving calculations and interpreting velocity- time graphs

Practice exam questions on speed/velocity-time graphs

Acceleration is about change in speed or velocity of an object and is not the same as speed or velocity.

Acceleration has its own defined formula, which expresses a change in velocity in a defined time interval.

acceleration = change in velocity ÷ time taken to effect the velocity change

a (m/s2) = Δv (m/s) ÷ Δt (s)

a = acceleration in metres per second squared m/s2Δv = change in speed/velocity in metres/second m/s

Δt = the time taken for the speed/velocity change in seconds, s

The formula for acceleration can also be written as:

a = (v - u) ÷ t = Δv ÷ t

where v = final speed/velocity,  u = initial speed/velocity,  t = time taken to change from velocity u to v

Rearrangements of acceleration formula: If a = Δv ÷ t   then   Δv = a x t    and   t = Δv ÷ a


Velocity - time graphs - illustrating the motion of objects A to F

From the graphs you can deduce several things:

From the gradient you can obtain the acceleration or deceleration (negative acceleration).

From the area under the 'triangles' or 'rectangles' of the velocity - time graph you can deduce the distance travelled - the displacement equals the area under a velocity time graph.

In terms of units, the distance calculation is equivalent to time x (distance / time = v)

e.g. = time x speed = v x m/s = m

velocity - time graphs linear uniform acceleration gradient calculations gcse physics igcse international courses

Graph (1) Linear or uniform acceleration

Both graph lines represent a linear increase in velocity AND the acceleration is constant.

From the equation a (m/s2) = Δv (m/s) ÷ Δt (s)

For object A: acceleration = (50 - 0)  ÷ (25 - 0) = 2.0 m/s2

For object B: acceleration = (50 - 30)  ÷ (20 - 0) = 1.0 m/s2

Note that the steeper the gradient, the greater the acceleration, the greater the rate of 'speeding up'.

Examples of distance travelled calculations from graph (1)

Here you are only dealing with an area of a triangle.

For object A between 0 and 20 seconds the distance travelled = (20 x 40) / 2 = 400 m

Because you are working with the area of a triangle, don't forget to halve the calculation!

For object B between 0 and 20 seconds the distance travelled = {20 x (50 - 30)} / 2 = 200 m


velocity - time graphs constant velocity zero acceleration gradient calculations gcse physics igcse international courses

Graph (2) Constant velocity - zero acceleration

The graph lines are horizontal, indicating there is no change in velocity, therefore zero acceleration.

Graph line C for object C represents a constant velocity of 20 m/s.

Graph line D represents an object D moving at twice the speed of C at 40 m/s.

Examples of distance travelled calculations from graph (2)

You are only dealing with a rectangle.

e.g. distance travelled by object C between 5 and 15 seconds = (15 - 5) x (20-0) = 200 m

and distance travelled by object D between 0 and 25 seconds = (25 - 0) x (40 - 0) = 1000 m


velocity - time graphs linear uniform negative acceleration deceleration gradient calculations gcse physics igcse international courses

Graph (3) Deceleration - negative acceleration

Both graph lines represent a linear decrease in velocity AND the deceleration (negative acceleration) is constant.

From the equation a (m/s2) = Δv (m/s) ÷ Δt (s)

For object E: acceleration = (0 - 40)  ÷ (25 - 0) = -1.6 m/s2

For object F: acceleration = (30 - 50)  ÷ (25 - 0) = -0.8 m/s2

Remember, if you express the answers as 1.6 m/s2 and 0.8 m/s2, it might be a good idea to say 'deceleration' or 'slowing down' too!

Note that the steeper the gradient, the greater the deceleration, the greater the rate of 'slowing down'.

Examples of distance travelled calculations from graph (3)

Again, like graph (1), it only involves the area of a triangle.

Distance travelled by object E between 0 and 25 seconds = 25 x (40 - 0) / 2 = 500 m

Distance travelled by object F between 10 and 25 seconds = (25 - 10) x (42 - 30) / 2 = 90 m


Note on the use of words:

You can think of deceleration is negative acceleration, so when a moving object is slowing down the rate of change in speed/velocity with time is negative.

Therefore you can think of acceleration as the positive rate of change of velocity.

But, you may find that the deceleration isn't used, and a negative sign used with the word acceleration.

So watch out for mathematical signs and how the words acceleration and deceleration are used.


Example calculations based on the acceleration formula and velocity-time graph interpretation

Q1 A car accelerates from 10 m/s to 30 m/s in 15 seconds.

Calculate the acceleration of the car.

Worked out answers to the questions


Q2 A train accelerates at 0.50 m/s2 for 30 seconds.

Worked out answers to the questions


Q3 If a car accelerates at 0.30 m/s2 from a standing start, how long will it take to attain a speed of 21 m/s?

Worked out answers to the questions


Q4 A car brakes sharply from moving at 30 m/s to 10 m/s in 4.0 seconds.

Calculate the deceleration of he car.

Worked out answers to the questions


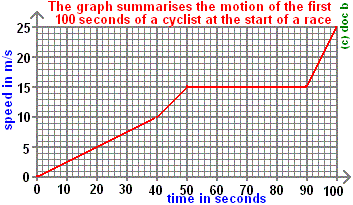
Q5 The graph below summarises the first 100 seconds of a cyclist's race.

When calculating displacement (distance travelled), with this velocity - time graph, both triangles and rectangles are involved.

(a) (i) What is the initial uniform acceleration of the cyclist in this time period?

(ii) How far has the cyclist travelled in this period?

(b) At which point is the cyclist's acceleration the greatest? and calculate the acceleration at this point.

Worked out answers to the questions


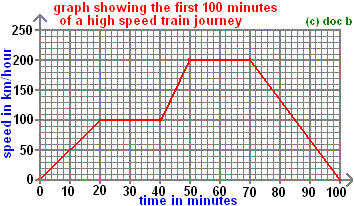
Q6 The graph below summarises a 100 minute commuter train journey, but with some signal delays!

Watch out for min ==> hour conversions!

(a) At what time or times is the train moving at constant speed? Explain your reasoning.

(b) Where is the greatest acceleration and what is its value in km/hour2?

(c) How far does the train travel in the first 20 minutes?

Worked out answers to the questions


Q7  A car travelling at 36 m/s skids off the road and hits a wall.

If the car is brought to a halt in 2.0 seconds, what is the average deceleration of the car?

final velocity v = 0, initial velocity u = 36 m/s

acceleration a = (v - u) ÷ t = Δv ÷ t = (0 - 36) / 2.0 = -18 m/s2

So the average deceleration is 18 m/s2

Note: The acceleration due to gravity is 9.8 m/s2, so in this crash you body would experience a force of nearly '2G', not good for your body!

Worked out answers to the questions


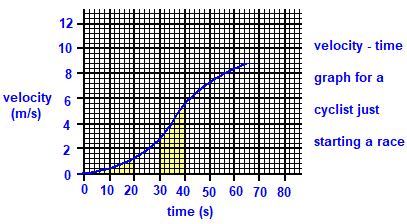
Q8 The graph below profiles the speed of a cyclist at the start of a race.

NOT a linear graph!

You get the distance travelled by calculating or measuring off the graph, the area under the graph for the specified time interval. To help you appreciate the method, I've highlighted two areas in yellow to be estimated to answer the two questions below.

(a) How far does the cyclist travel in the first 20 seconds of the race? (give your answers to 2 s.f.)

(b) How far does the cyclist travel between the 30th and 40th second of the race.

Do you agree with my estimations?

Worked out answers to the questions


Q9 A van is travelling at 20 m/s has its brakes applied for 5.0 seconds.

If this produces a deceleration of -1.5 m/s2, calculate the velocity of the van after braking.

Worked out answers to the questions


Q10 If an object is fired vertically up in the air from ground level and falls back down.

(a) Describe the energy store changes taking place and any assumptions you are making in your arguments. Assume the object leaves from, and returns to, the ground level.

(b) Sketch the graph of velocity versus time for the whole flight.

 (c) Can you suggest a value for the gradients of the graph?

Worked out answers to the questions


Notes index on acceleration, deceleration, velocity/speed-time graphs


Key points about acceleration and deceleration - practice exam questions

Information sources for Doc Brown's key points: IGCSE-GCSE physics are based on textbooks & syllabus-specifications for students taking the UK AQA, Edexcel, OCR 21st Century Science, OCR Gateway science suite, WJEC, CCEA and CIE GCSE physics 9-1 level science examinations


Keywords, phrases and learning objectives for acceleration and graph work

Be able to interpret velocity/speed-time graphs and perform calculations using the acceleration formula.

Be able to interpret velocity-time graphs in terms of speed changes and distance covered in a given time.


SITEMAP Website content © Dr Phil Brown 2000+. All copyrights reserved on Doc Brown's physics revision notes, images, quizzes, worksheets etc. Copying of website material is NOT permitted. Exam revision summaries and references to GCSE science course specifications are unofficial.

Notes index on acceleration, deceleration, velocity/speed-time graphs

Worked out ANSWERS to the velocity-time graph and other calculation questions on acceleration/deceleration questions

Q1 A car accelerates from 10 m/s to 30 m/s in 15 seconds.

Calculate the acceleration of the car.

a (m/s2) = Δv (m/s) ÷ Δt (s) ÷ a

If u and v are the initial and final velocities

a = (v - u) / t = (30 - 10) / 15 = 20 / 15 = 1.3 m/s2 (2 s.f.)


Q2 A train accelerates at 0.50 m/s2 for 30 seconds.

What is the increase in speed of the train?

a = Δv ÷ t   so   Δv = a x t

increase in speed = 0.5 x 30 = 15 m/s (2 s.f.)


Q3 If a car accelerates at 0.30 m/s2 from a standing start, how long will it take to attain a speed of 21 m/s?

a = Δv ÷ Δt   so   Δt = Δv ÷ a = (v - u) ÷ a, u and v are the initial and final velocities

time taken = (21 - 0) ÷ 0.30 = 21 s  (2 s.f.)


Q4 A car brakes sharply from moving at 30 m/s to 10 m/s in 4.0 seconds.

Calculate the deceleration of he car.

a = Δv ÷ Δt

If u and v are the initial and final velocities

a = (10 - 30) / 4.0 = 20 / 4 = -5.0 m/s2  (2 s.f.)

Note the minus sign for the acceleration - because the car is slowing down!

You can then say the deceleration is 5.0 m/s2  (2 s.f.)


Q5 The graph below summarises the first 100 seconds of a cyclist's race.

When calculating displacement (distance travelled), with this velocity - time graph, both triangles and rectangles are involved.

(a) (i) What is the initial uniform acceleration of the cyclist in this time period?

The initial acceleration is from 0 to 40 seconds.

speed = total change in speed / time taken = (10 - 0) / (40 - 0) = 10 / 40 = 0.25 m/s2 (2 s.f.)

(ii) How far has the cyclist travelled in this period?

From a speed/velocity-time graph you calculate distance covered from the area under the graph for the time period involved.

Area under the graph from 0 to 40 seconds = 10 x 40 / 2 = 200 m  (its easy if the graph is linear)

(b) At which point is the cyclist's acceleration the greatest? and calculate the acceleration at this point.

The steeper the gradients the greater the acceleration.

The gradient is steepest from 90 to 100 seconds, so that is the time period of greatest acceleration.

a = ∆v / ∆t = (25 - 20) / (100 - 90) = 5 / 10 = 0.5 m/s2


Q6 The graph below summarises a 100 minute commuter train journey, but with some signal delays!

Watch out for min ==> hour conversions!

(a) At what time or times is the train moving at constant speed? Explain your reasoning.

From the 20th to 40th minute AND from the 50th to 70th minute.

The graph is horizontal, indicating constant speed (of 100 km/hour and 200 km/hour).

(b) Where is the greatest acceleration and what is its value in km/hour2?

Steepest gradient is from the 40th to the 50th minute.

Change in velocity = 200 - 100 = 100 km/hour

Time involved = 50 - 40 = 10 mins, 10/60 = 0.167 hours

gradient = 100 / 0.167 = 100 / 0.167 = ~600 km/hour2

(c) How far does the train travel in the first 20 minutes?

time = 20 / 60 = 0.333 hours, speed change = 100 - 0 = 100 km/hour.

area under graph = 100 x 0.333 / 2 = 16.7 km, ~17 km


Q7  A car travelling at 36 m/s skids off the road and hits a wall.

 If the car is brought to a halt in 2.0 seconds, what is the average deceleration of the car?

final velocity v = 0, initial velocity u = 36 m/s

acceleration a = (v - u) ÷ t = Δv ÷ t = (0 - 36) / 2.0 = -18 m/s2

So the average deceleration is 18 m/s2

Note: The acceleration due to gravity is 9.8 m/s2, so in this crash you body would experience a force of nearly '2G', not good for your body!


Q8 The graph below profiles the speed of a cyclist at the start of a race.

NOT a linear graph!

You get the distance travelled by calculating or measuring off the graph, the area under the graph for the specified time interval. To help you appreciate the method, I've highlighted two areas in yellow to be estimated to answer the two questions below.

Step 1 is to work out the distance relating to one small square.

From the 'bold' graph lines larger square you have 5 x 5 = 25 small squares = 2 m/s x 20 s = 40 m,

so each small square = 40 / 25 = 0.625 m, so from this you can estimate the areas and distances.

(a) How far does the cyclist travel in the first 20 seconds of the race? (give your answers to 2 s.f.)

0-10s ~ 2 squares, 10-20s ~9, total ~11 squares = ~11 x 0.625 = 6.88, distance travelled ~6.9 m

(b) How far does the cyclist travel between the 30th and 40th second of the race.

total small squares  = 25 + 22 (25-~3) + 5.5 = ~52.5, distance travelled = 52.5 x 0.625 = ~32.8 = ~32 m

Do you agree with my estimations?


Q9 A van is travelling at 20 m/s has its brakes applied for 5.0 seconds.

If this produces a deceleration of -1.5 m/s2, calculate the velocity of the van after braking.

a = Δv ÷ Δt

Δv = (v - u) = a x t  = -1.5 x 5.0 = -7.5

v - u = -7.5,  v - 20 = -7.5,  v = -7.5 + 20 = 12.5 m/s


Q10 If an object is fired vertically up in the air from ground level,

(a) Describe the energy store changes taking place and any assumptions you are making in your arguments. Assume the object leaves from, and returns to, the ground level.

When the object is thrown upwards it is given an initial maximum kinetic energy store.

As it rises the velocity decreases, its kinetic energy store (KE) decreases and its gravitational potential energy store (GPE) increases proportionately - this assume no other energy transfers are occurring.

This ignores the friction effect of air resistance - some KE is lost as thermal energy to increase the thermal energy store of the surroundings.

The decrease in velocity is due to the decelerating effect of the Earth's gravitational field.

When it reaches its maximum height, the object has its maximum GPE.

The object then accelerates back down to the ground, again due to the Earth's gravitational field.

At the same time, as the velocity increases, the object's GPE store is converted to its KE store and it hits the ground at its maximum velocity and with its maximum KE. This assumes no air resistance.

(b) Sketch the graph of velocity versus time for the whole flight.

There are two graph formats you can draw to illustrate the change in velocity with time and both are illustrated below.

velocity - time graph for throwing an object up in the air gcse physics igcse international gcse physics

Graph A is constructed in two halves.

From the maximum velocity x, the left half represents the decrease in velocity as the object's motion is slowed down by the Earth's gravitational field.

You can think of this as a negative acceleration i.e. deceleration - a negative gradient (-a, -m/s2).

The right half represents the increase in velocity as the object falls under gravity, attaining the maximum velocity x on hitting the ground.

You can think of this as a positive acceleration - a positive gradient (+a, +m/s2).

Graph A ignores the mathematical convention of a minus velocity on change of direction.

The bottom of the V, at time t, represents zero velocity as the object's motion is on the point of reversing direction to fall down.

Graph B is constructed as one continuous line.

This uses both positive and negative values of velocity, to represent the change in direction.

Therefore the velocity changes from +x to -x in a time of 2 x t, t being the point of zero velocity

 (c) Can you suggest a value for the gradients of the graph?

The gradients in each case would have the value of the Earth's gravitational acceleration/deceleration constant of 9.8 m/s2.


Notes index on acceleration, deceleration, velocity/speed-time graphs


Website content © Dr Phil Brown 2000+. All copyrights reserved on Doc Brown's physics revision notes, images, quizzes, worksheets etc. Copying of website material is NOT permitted. Exam revision summaries and references to science course specifications are unofficial. Explaining the importance of explaining velocity-time graph calculations in GCSE physics, What you need to know about explaining velocity-time graph calculations for IGCSE physics, Explaining the use of explaining velocity-time graph calculations knowledge in GCSE physics, Examples of explaining velocity-time graph calculations explained for GCSE physics exams, What is the significance of explaining velocity-time graph calculations in studying for physics exams, What is the use of explaining velocity-time graph calculations ?  Describing and explaining the theory of explaining velocity-time graph calculations, revision preparation for AQA GCSE physics, Edexcel GCSE physics, OCR GCSE physics. Website content © Dr Phil Brown 2000+. All copyrights reserved on Doc Brown's physics revision notes, images, quizzes, worksheets etc. Copying of website material is NOT permitted. Exam revision summaries and references to science course specifications are unofficial. These revision notes on explaining velocity-time graph calculations are suitable for AQA gcse physics, explaining velocity-time graph calculations revision notes for Edexcel gcse physics, explaining velocity-time graph calculations revision notes for OCR gcse Gateway science physics, explaining velocity-time graph calculations revision notes for OCR 21st Century science physics, explaining velocity-time graph calculations revision notes WJEC GCSE physics, explaining velocity-time graph calculations revision notes for CCEA gcse physics, explaining velocity-time graph calculations revision notes for CIE Cambridge IGCSE physics exams. explaining velocity-time graph calculations explained with examples, help in revising explaining velocity-time graph calculations for gcse physics exams, knowing the importance of explaining velocity-time graph calculations for gcse physics exams, key points to know about explaining velocity-time graph calculations, exam revision notes for explaining velocity-time graph calculations, what you need to know about explaining velocity-time graph calculations, revision help in learning about explaining velocity-time graph calculations, importance of problem solving with velocity-time graphs for practise exam questions on acceleration, constant velocity or deceleration in GCSE level physics, What you need to know about problem solving with velocity-time graphs for practise exam questions on acceleration, constant velocity or deceleration for GCSE level physics, Explaining the use of problem solving with velocity-time graphs for practise exam questions on acceleration, constant velocity or deceleration knowledge in GCSE level physics, Examples of problem solving with velocity-time graphs for practise exam questions on acceleration, constant velocity or deceleration explained when studying GCSE level physics, What is significant about problem solving with velocity-time graphs for practise exam questions on acceleration, constant velocity or deceleration, describing the theory of problem solving with velocity-time graphs for practise exam questions on acceleration, constant velocity or deceleration when studying GCSE level physics, revision notes for problem solving with velocity-time graphs for practise exam questions on acceleration, constant velocity or deceleration in exams, online exam help for problem solving with velocity-time graphs for practise exam questions on acceleration, constant velocity or deceleration, revision notes about problem solving with velocity-time graphs for practise exam questions on acceleration, constant velocity or deceleration, what do I need to learn about problem solving with velocity-time graphs for practise exam questions on acceleration, constant velocity or deceleration for by GCSE physics exam? help to understand the problem solving with velocity-time graphs for practise exam questions on acceleration, constant velocity or deceleration topic in preparation for GCSE physics exam question, how to prepare for questions involving problem solving with velocity-time graphs for practise exam questions on acceleration, constant velocity or deceleration in a GCSE physics examination?


Notes index on acceleration, deceleration, velocity/speed-time graphs

TOP OF PAGE